Was Earth already heating up, or did global warming reverse a long-term cooling trend?
Over the past century, the Earth’s average temperature has swiftly increased by about 1 degree Celsius (1.8 degrees Fahrenheit)

Estimated reading time: 11 minutes
Ellie Broadman, University of Arizona and Darrell Kaufman, Northern Arizona University
The evidence is hard to dispute. It comes from thermometers and other sensors around the world.
But what about the thousands of years before the Industrial Revolution, before thermometers, and before humans warmed the climate by releasing heat-trapping carbon dioxide from fossil fuels?
Back then, was Earth’s temperature warming or cooling?
Even though scientists know more about the most recent 6,000 years than any other multimillennial interval, studies on this long-term global temperature trend have come to contrasting conclusions.
To try to resolve the difference, we conducted a comprehensive, global-scale assessment of the existing evidence, including both natural archives, like tree rings and seafloor sediments, and climate models. Our results, published Feb. 15, 2023, suggest ways to improve climate forecasting to avoid missing some important slow-moving, naturally occurring climate feedbacks.
Global warming in context
Scientists like us who study past climate, or paleoclimate, look for temperature data from far back in time, long before thermometers and satellites.
We have two options: We can find information about past climate stored in natural archives, or we can simulate the past using climate models.
There are several natural archives that record changes in the climate over time. The growth rings that form each year in trees, stalagmites and corals can be used to reconstruct past temperature. Similar data can be found in glacier ice and in tiny shells found in the sediment that builds up over time at the bottom of the ocean or lakes. These serve as substitutes, or proxies, for thermometer-based measurements.
For example, changes in the width of tree rings can record temperature fluctuations. If temperature during the growing season is too cold, the tree ring forming that year is thinner that one from a year with warmer temperatures.
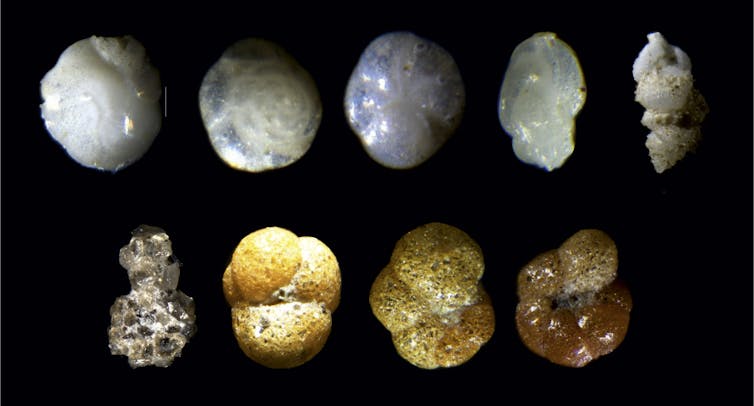
Another temperature proxy is found in seafloor sediment, in the remains of tiny ocean-dwelling creatures called foraminifera. When a foraminifer is alive, the chemical composition of its shell changes depending on the temperature of the ocean. When it dies, the shell sinks and gets buried by other debris over time, forming layers of sediment at the ocean floor. Paleoclimatologists can then extract sediment cores and chemically analyze the shells in those layers to determine their composition and age, sometimes going back millennia.
Climate models, our other tool for exploring past environments, are mathematical representations of the Earth’s climate system. They model relationships among the atmosphere, biosphere and hydrosphere to create our best replica of reality.
Climate models are used to study current conditions, forecast changes in the future and reconstruct the past. For example, scientists can input the past concentrations of greenhouse gases, which we know from information stored in tiny bubbles in ancient ice, and the model can use that information to simulate past temperature. Modern climate data and details from natural archives are used to test their accuracy.
Proxy data and climate models have different strengths.
Proxies are tangible and measurable, and they often have a well-understood response to temperature. However, they are not evenly distributed around the world or through time. This makes it difficult to reconstruct global, continuous temperatures.
In contrast, climate models are continuous in space and time, but while they are often very skillful, they will never capture every detail of the climate system.
A paleo-temperature conundrum
In our new review paper, we assessed climate theory, proxy data and model simulations, focusing on indicators of global temperature. We carefully considered naturally occurring processes that affect the climate, including long-term variations in Earth’s orbit around the Sun, greenhouse gas concentrations, volcanic eruptions and the strength of the Sun’s heat energy.
We also examined important climate feedbacks, such as vegetation and sea ice changes, that can influence global temperature. For example, there is strong evidence that less Arctic sea ice and more vegetation cover existed during a period around 6,000 years ago than in the 19th century. That would have darkened the Earth’s surface, causing it to absorb more heat.

Our two types of evidence offer different answers regarding the Earth’s temperature trend over the 6,000 years before modern global warming. Natural archives generally show that Earth’s average temperature roughly 6,000 years ago was warmer by about 0.7 C (1.3 F) compared with the 19th century median, and then cooled gradually until the Industrial Revolution. We found that most evidence points to this result.
Meanwhile, climate models generally show a slight warming trend, corresponding to a gradual increase in carbon dioxide as agriculture-based societies developed during the millennia after ice sheets retreated in the Northern Hemisphere.
How to improve climate forecasts
Our assessment highlights some ways to improve climate forecasts.
For example, we found that models would be more powerful if they more fully represented certain climate feedbacks. One climate model experiment that included increased vegetation cover in some regions 6,000 years ago was able to simulate the global temperature peak we see in proxy records, unlike most other model simulations, which don’t include this expanded vegetation.
Understanding and better incorporating these and other feedbacks will be important as scientists continue to improve our ability to predict future changes.![]()
Ellie Broadman, Postdoctoral Research Associate in Climate Science, University of Arizona and Darrell Kaufman, Professor of Earth and Environmental Sciences, Northern Arizona University
This article is republished from The Conversation under a Creative Commons license. Read the original article.
What's Your Reaction?


