War in Ukraine at 2 years: Destruction seen from space – via radar
We exclusively used open-source, freely accessible data to ensure that all our findings could be reproduced, guaranteeing transparency and neutrality
Estimated reading time: 12 minutes
Sylvain Barbot, USC Dornsife College of Letters, Arts and Sciences
As soldiers and citizens provide information from the front lines and affected areas of the war in Ukraine – two years old as of Feb. 24, 2024 – in quasi-real time, an active open-source intelligence community has formed to keep track of troop activity, destruction and other aspects of the war.
Remote sensing complements this approach, offering a safe means to study inaccessible or dangerous areas. For example, seismologists have documented the high pace of bombardments and firing of artillery around Kyiv during the first few months of the war.
Previously, Teng Wang, a professor at the Peking University in China, and I – both Earth scientists – studied illegal nuclear tests in North Korea with satellite data.
Putting our skills to good use once again, we, with graduate student Hang Xu, have analyzed the development of the war from space.
View from above
Sensors on satellites record electromagnetic waves radiated or reflected from Earth’s surface with wavelengths ranging from hundreds of nanometers to tens of centimeters, enabling semi-continuous monitoring on a global scale, unimpeded by political boundaries and natural obstacles.
Optical images, the equivalent of photographs taken from space, help governments, researchers and journalists monitor troop movements on the front and the destruction of equipment and facilities. Although optical images are easily interpreted, they suffer from cloud cover and operate only during daylight.
To counter these issues, we used radars onboard satellites. Space-borne radar systems beam long-wavelength electromagnetic waves toward the Earth and then record the returning echos. These waves – about 0.4 to 4 inches (1 to 10 centimeters) – can penetrate clouds and smoke. Radar interferometry has already proved to be an invaluable tool to monitor widespread damage caused by natural disasters.
Radar from space
Free and publicly available radar data for civilian applications is rare – the United States is scheduled to launch its first one in March 2024 – but the European Space Agency has made such data available since the early 1990s. Data from the European Space Agency’s Sentinel-1 satellite radar is freely accessible via their data hub.
Two radar images formed over the same area can be used to detect changes to structures and other surfaces. Interferometry measures the difference in travel time between two radar signals, which is a measure of change in the shape or position of surfaces. Another measure of surface change is the coherence of the reflected signals – that is, the degree of similarity between two different images when comparing neighboring pixels at the same position in the two images. A large coherence implies little change and thus the preservation of a building or other structure. On the other hand, a loss of coherence in the context of a battlefield implies damage or destruction of a building or structure.
Sentinel-1 radar’s spatial resolution of 66 feet (20 meters) over a swath of 255 miles (410 kilometers) combined with 12-day updates makes its radar data ideal for monitoring urban warfare. Previous research efforts have used satellite radar data to assess damage in Kyiv and Mariupol. We used the data to analyze the evolution of damage to cities over time during several lengthy battles.

Measure of destruction
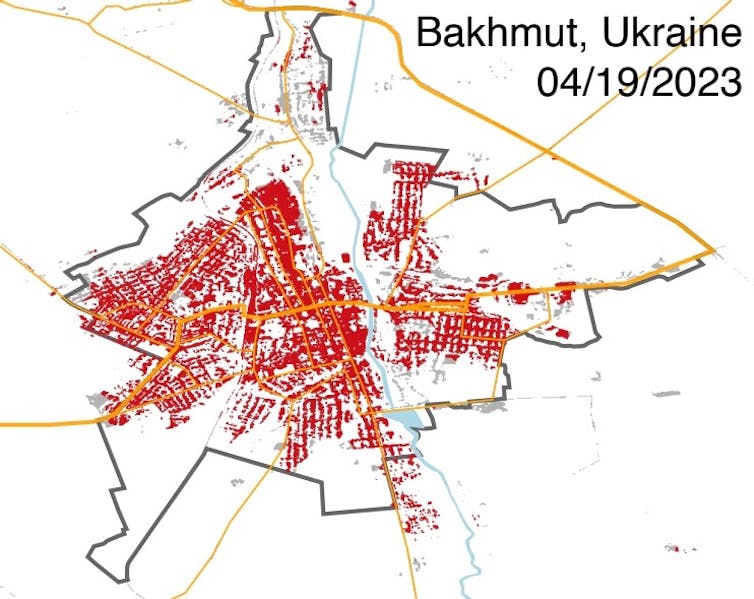
We flagged highly damaged areas by comparing radar coherence before and after the war, within the areas classified as artificial surfaces by the European Space Agency’s WorldCover 2021 dataset. Using this approach, we first analyzed the battle of Bakhmut, one of the longest and bloodiest of the war, which began on Oct. 8, 2022, and ended with a Russian victory on May 20, 2023.
When Hang Xu showed Teng Wang and me the data he had processed, we were puzzled. We saw a checkerboard pattern all over the city. We quickly realized the horror of the situation. The only thing that survived after the yearlong battle was the network of roads in the city. All buildings had partially or completely collapsed due to the continuous bombardment.
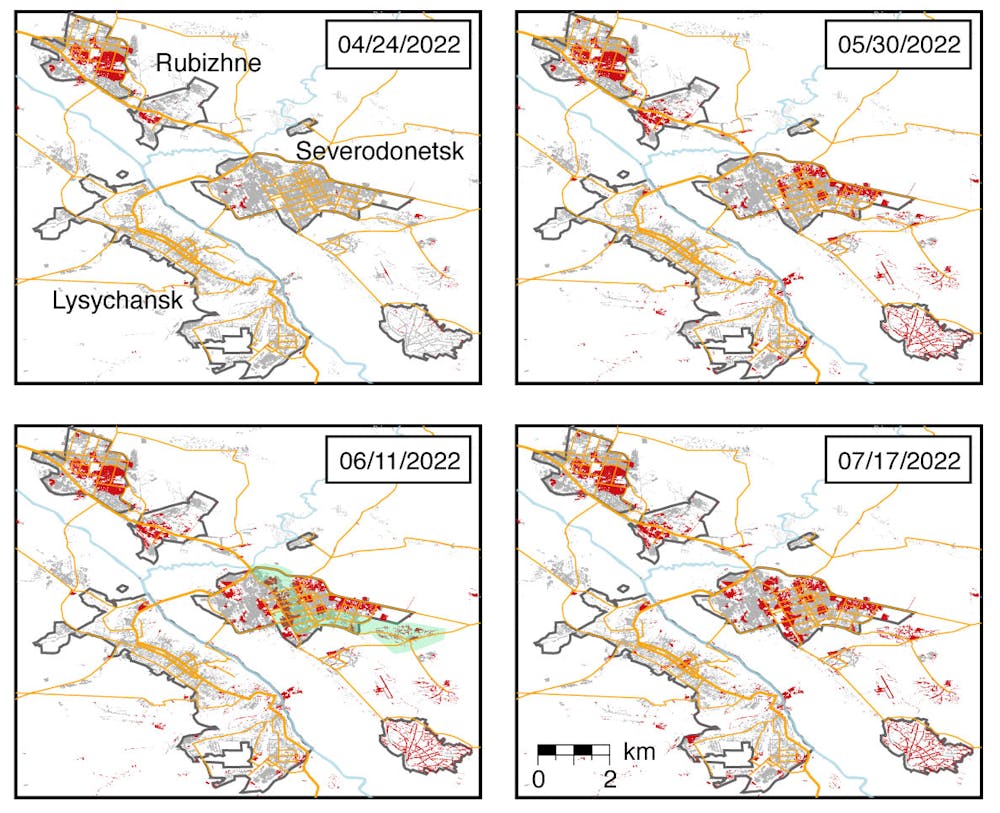
We then took a look at the battles of Rubizhne, Sievierodonetsk and Lysychansk that started in April 2022 and ended with a Russian victory on July 2, 2022. The comparatively lower destruction of Lysychansk is explained by the rapid encirclement of the city from the south instead of continued frontal assaults, as was the case in Bakhmut. The radar data reveals destruction away from the front line within cities, showing the whole extent of the devastation.
Devastation in focus
Remote sensing images offer the means to safely monitor the impact of armed conflicts, particularly as high-intensity wars in urban environments proliferate. Open-access satellite instruments complement other forms of open-source intelligence by offering unimpeded access to high-resolution, unbiased information, which can help people grasp the true impact of war on the ground.
The picture is clear: The real story of war is destruction.![]()
Sylvain Barbot, Associate Professor of Earth Sciences, USC Dornsife College of Letters, Arts and Sciences
This article is republished from The Conversation under a Creative Commons license. Read the original article.
What's Your Reaction?